Debugging Tile Language Programs
Overview
A Tile Language program (hereafter referred to as a program) is transformed into a hardware-executable file through several stages:
The user writes a Tile Language program.
The program undergoes multiple Passes for transformation and optimization (the lower stage, see
tilelang/engine/lower.py), finally producing an intermediate representation (e.g., LLVM or C for CPU, CUDA for NVIDIA GPUs, etc.).The generated code is compiled by the respective compiler (e.g., nvcc) into a hardware-executable file.
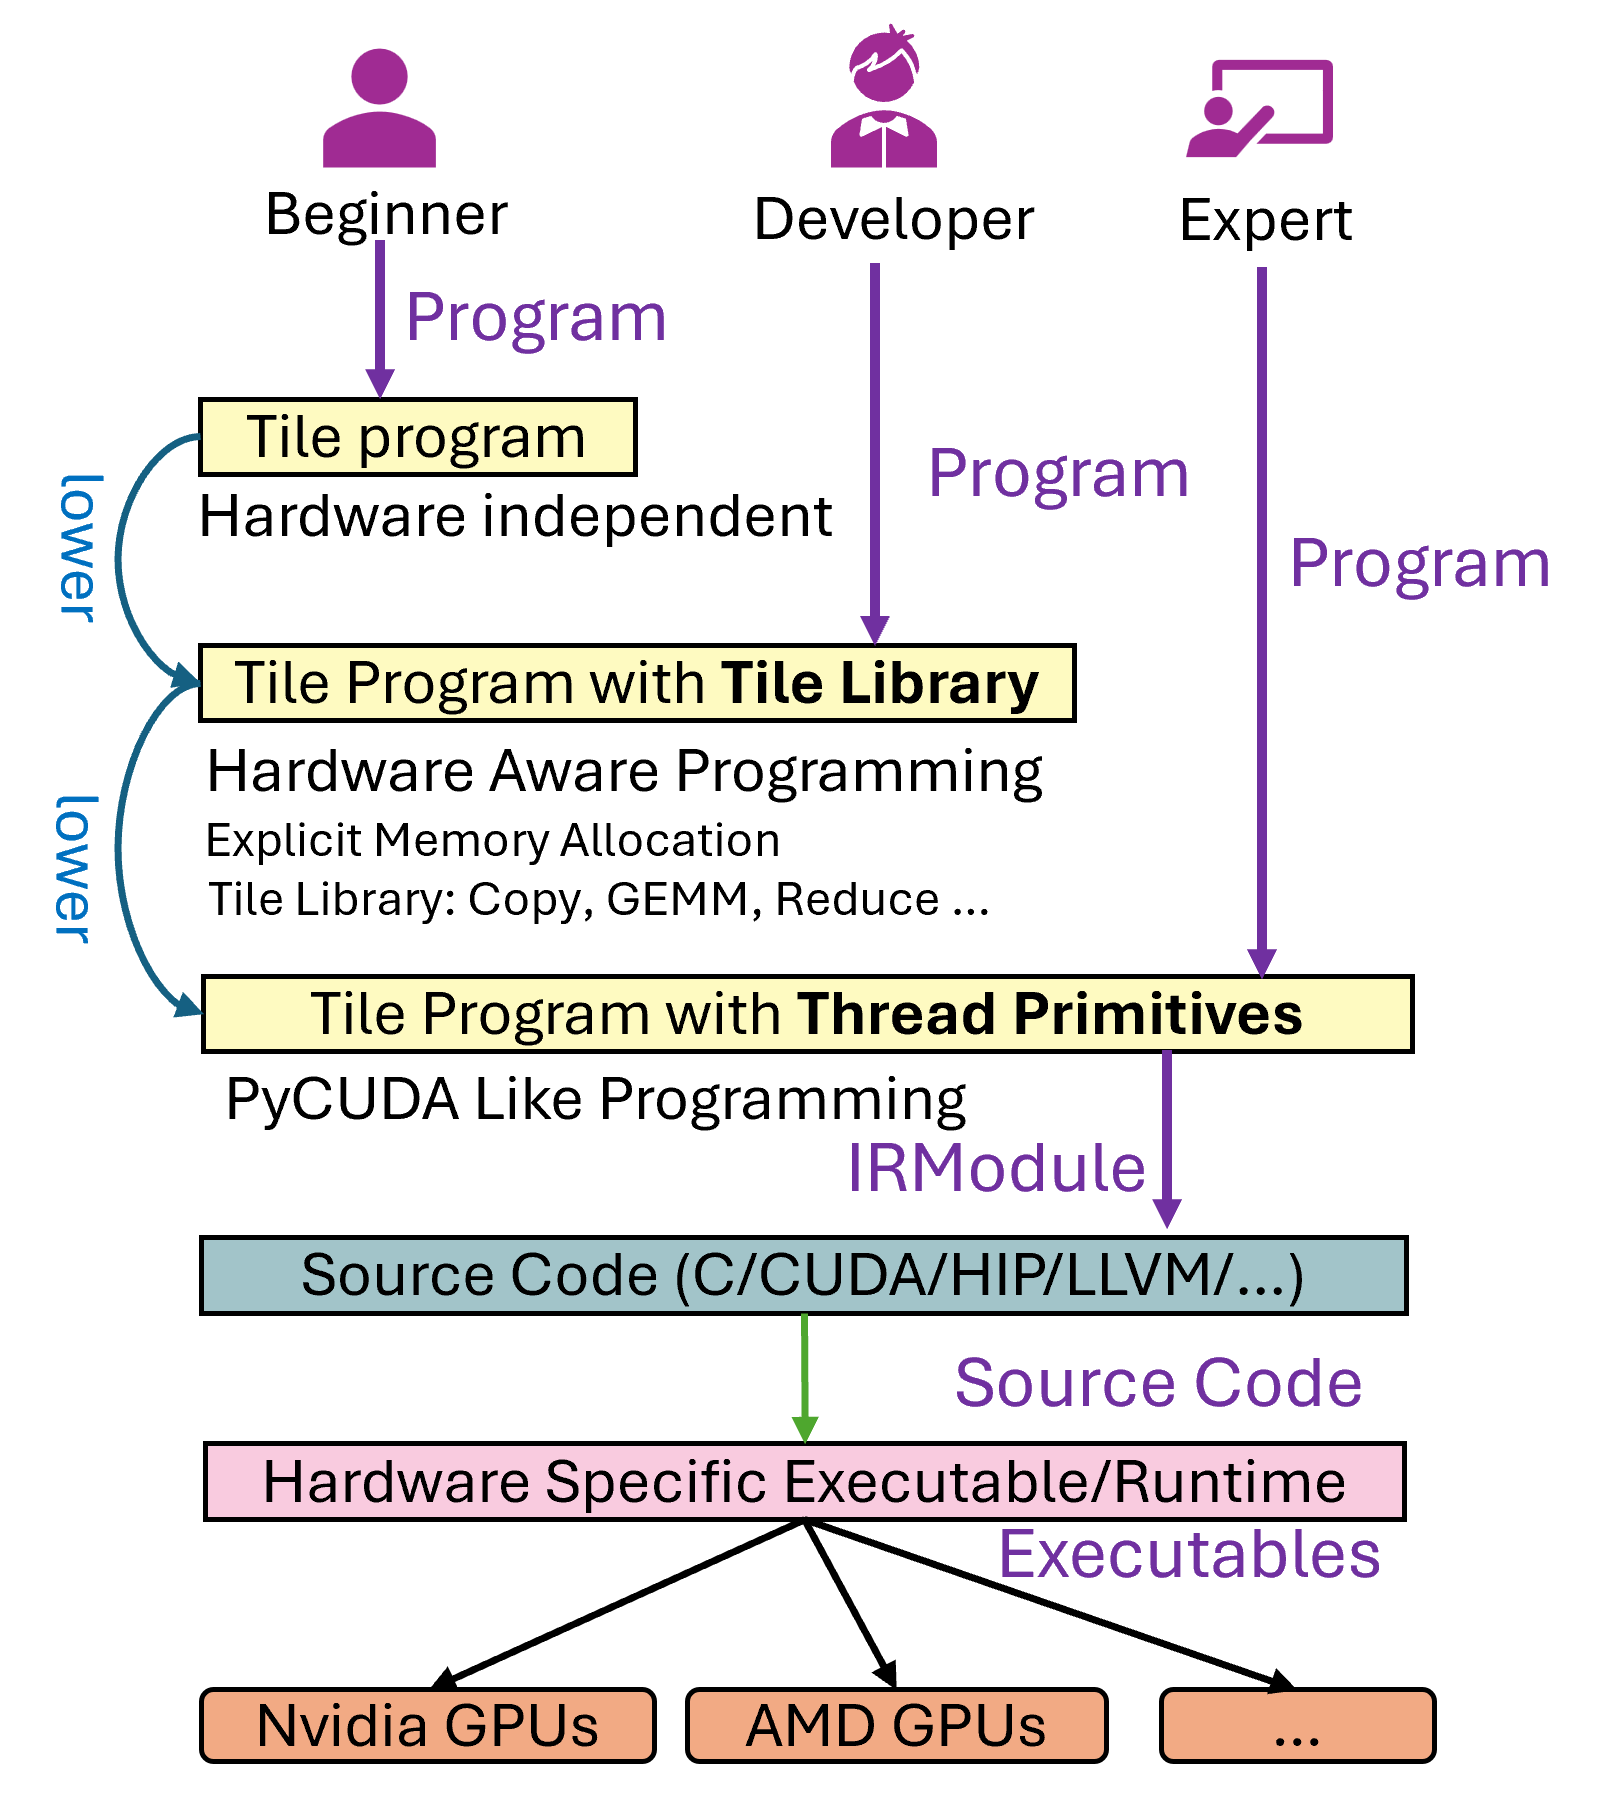
During this process, users may encounter roughly three categories of issues:
Generation issues: The Tile Language program fails to generate a valid hardware-executable file (i.e., errors during the lowering process).
Correctness issues: The resulting executable runs, but produces incorrect results.
Performance issues: The executable runs with performance significantly below the expected theoretical hardware limits.
This tutorial focuses on the first two issues—how to debug generation and correctness problems. Performance tuning often requires using vendor-provided profiling tools (e.g., Nsight Compute, rocProf, etc.) for further hardware-level analysis, which we will address in future materials.
Below, we take matrix multiplication (GEMM) as an example to demonstrate how to write and debug a Tile Language program.
Matrix Multiplication Example
In Tile Language, you can use the Tile Library to implement matrix multiplication. Here’s a complete example:
import tilelang
import tilelang.language as T

def matmul(M, N, K, block_M, block_N, block_K, dtype="float16", accum_dtype="float"):
    # ...existing code...

# 1. Define the kernel (matmul) with the desired dimensions
func = matmul(1024, 1024, 1024, 128, 128, 32)

# 2. Compile the kernel into a torch function
# ...existing code...
Debugging Generation Issues
TileLang essentially performs progressive lowering. For example, a T.copy may first be expanded into T.Parallel (see the pass LowerTileOP), which is then expanded again, eventually resulting in lower-level statements that can be translated to CUDA C code.
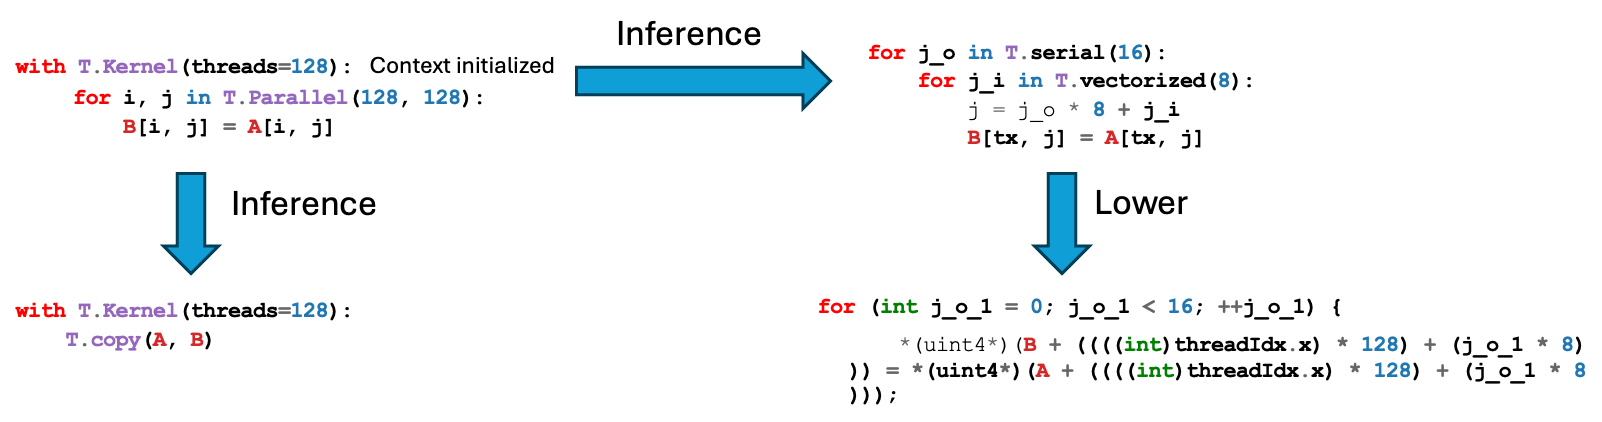
When the code fails to generate (for instance, a compilation error occurs), you do not necessarily need to jump directly into C++ passes to debug. Instead, you can first inspect the intermediate representations (IR) in Python by printing them.
For example, consider a case where a simple T.copy in 1D causes the lowering process to fail. The snippet below illustrates a simplified version of the problem (based on community Issue #35):
@T.prim_func
def main(Q: T.Tensor(shape_q, dtype)):
    # ...existing code...
The TileLang lower process might yield an error such as:
File "/root/TileLang/src/cuda/codegen/codegen_cuda.cc", line 1257
ValueError: Check failed: lanes <= 4 (8 vs. 4) : Ramp of more than 4 lanes is not allowed.
This indicates that somewhere during code generation, an unsupported vectorization pattern was introduced (a ramp of 8 lanes). Before diving into the underlying C++ code, it is helpful to print the IR right before code generation. For instance:
device_mod = tir.transform.Filter(is_device_call)(mod)
# ...existing code...
Debugging Correctness Issues
Sometimes, the kernel compiles and runs but produces incorrect results. In such cases, there are two main strategies to help debug:
Use post-processing callbacks to inspect or modify the generated CUDA code.
Use the built-in
T.printdebugging primitive to inspect values at runtime.
Post-Processing Callbacks for Generated Source
After code generation (in the codegen pass), TileLang calls a callback function (if registered) to allow post-processing of the generated source code. In src/cuda/codegen/rt_mod_cuda.cc:
std::string code = cg.Finish();
if (const auto *f = Registry::Get("tilelang_callback_cuda_postproc")) {
    code = (*f)(code, target).operator std::string();
}
Hence, by registering a Python function named tilelang_callback_cuda_postproc, you can intercept the final CUDA code string. For example:
import tilelang
import tilelang.language as T
from tilelang import tvm
from tilelang.engine.callback import register_cuda_postproc_callback

@register_cuda_postproc_callback
def tilelang_callback_cuda_postproc(code, _):
    print(code) # print the final CUDA code
    code = "// modified by tilelang_callback_cuda_postproc\n" + code
    return code

kernel = tilelang.compile(matmul, target="cuda")
kernel_source = kernel.get_kernel_source()
print(kernel_source)
'''
// modified by tilelang_callback_cuda_postproc
#include "cuda_runtime.h"
...
'''
Runtime Debug Prints with T.print
TileLang provides a built-in debugging primitive called T.print for printing within kernels. Be mindful of concurrency and thread synchronization when using it in GPU code. Below are some examples showing how to print buffers, variables, and other data inside TileLang programs.
Printing an Entire Buffer
def debug_print_buffer(M=16, N=16):
    # ...existing code...
Conditional Printing
def debug_print_buffer_conditional(M=16, N=16):
    # ...existing code...
Printing Thread Indices or Scalar Values
def debug_print_value_conditional(M=16, N=16):
    # ...existing code...
Printing Fragment (Register File) Contents
def debug_print_register_files(M=16, N=16):
    # ...existing code...
Adding a Message Prefix
def debug_print_msg(M=16, N=16):
    # ...existing code...
The output messages will include something like:
msg='hello world' BlockIdx=(0, 0, 0), ThreadIdx=(0, 0, 0): 0
Visual Layout Inference For TileLang
The Visual Layout Inference tool automatically generates visual diagrams that illustrate the mapping between logical indices, thread IDs, and register file locations.
When TileLang performs layout inference, it determines how fragment buffers are distributed across threads. The visual layout tool captures this information and generates:
Textual output: A human-readable description of the layout mapping
Visual diagrams: Color-coded plots showing the thread-to-data mapping
The visual layout inference tool is controlled through the TL_LAYOUT_VISUALIZATION_ENABLE and TL_LAYOUT_VISUALIZATION_FORMATS pass configuration. By default, TL_LAYOUT_VISUALIZATION_ENABLE is disabled to avoid performance overhead during compilation.
When enabled, TL_LAYOUT_VISUALIZATION_FORMATS accepts string values to control output formats:
“txt”: Text output only (same as default)
“all”: Generates all formats (TXT, PDF, PNG, SVG)
“png”: Generate PNG format only
“pdf”: Generate PDF format only
“svg”: Generate SVG format only
“txt,svg”: Generate multiple formats (comma-separated) in addition to text output
The output messages of “txt” will include something like:
C_local inferenced layout:
  Shape: [32, 32] -> [8]
  Thread: _j // 16 * 64 + _i // 16 * 32 + _i % 8 * 4 + _j % 8 // 2
  Index:  [_j % 16 // 8 * 4 + _i % 16 // 8 * 2 + _j % 2]
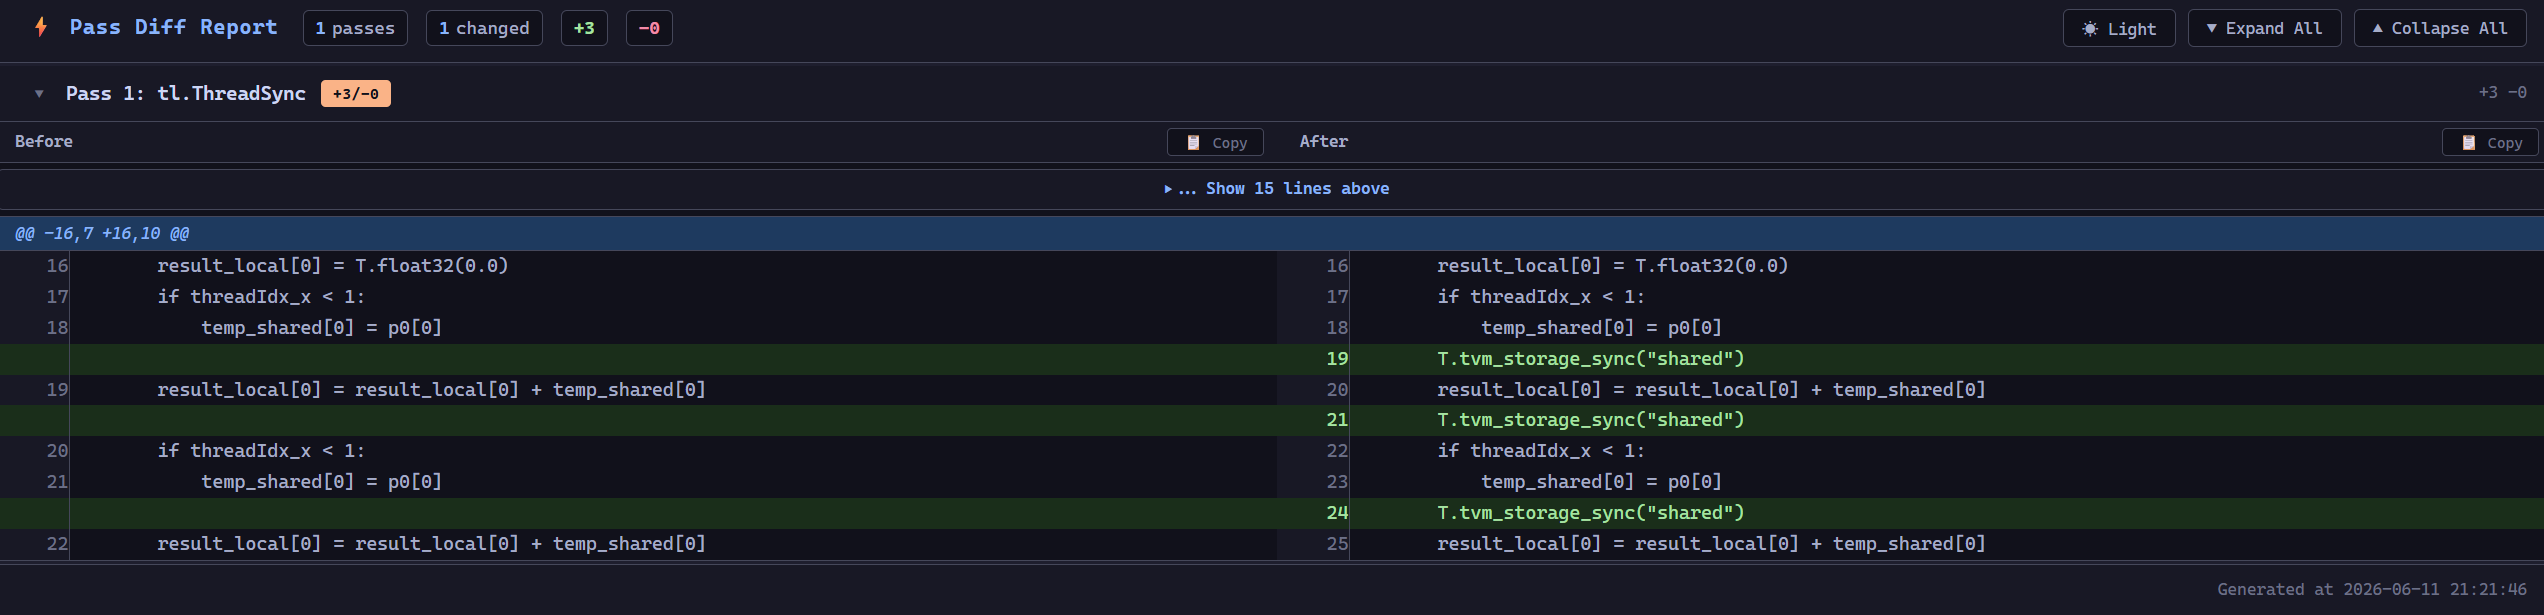
Pass Diff: Observing IR Changes Across Passes
TileLang programs are lowered through a sequence of compiler passes, each of which may transform the IR. Understanding exactly what each pass changes is essential for debugging incorrect transformations, unexpected optimizations, or missing passes.
TileLang provides a built-in Pass Diff tool that automatically captures the IR before and after every pass and generates a human-readable diff report. It works transparently — no code changes are required.
Quick Start (Environment Variable)
The simplest way to enable pass diff is to set the TILELANG_PASS_DIFF environment variable before running your script:
# Colored diff printed to the terminal
TILELANG_PASS_DIFF=terminal python3 my_script.py

# Generate an HTML report
TILELANG_PASS_DIFF=html python3 my_script.py

# Both terminal output and HTML report
TILELANG_PASS_DIFF=both python3 my_script.py

# Disabled (default — zero overhead)
python3 my_script.py
The HTML report is saved to the directory specified by the TILELANG_PASS_DIFF_OUTPUT environment variable (default: tmp/pass_diff_output). Each run produces a timestamped file, e.g. pass_diff_20260611_205421.html.
Environment Variables
Variable |
Description |
Default |
|---|---|---|
|
Enable pass diff. Values: |
|
|
Output directory for HTML reports |
|
HTML Report Features
The HTML report provides a rich diff viewer with:
Side-by-side before/after view for each pass, with color-coded insertions and deletions
Collapsible pass sections — click a pass header to expand or collapse its diff
Expand context — when a diff hunk hides unchanged lines, a
⋯ Show N lines above/belowcontrol lets you reveal themDark/Light theme toggle — the default dark theme can be switched via the toolbar button; the preference is persisted across sessions
Copy buttons — copy the before or after IR of any pass to the clipboard
Summary statistics — total passes, changed passes, insertions, and deletions shown in the toolbar
Programmatic API
For more fine-grained control, you can use the pass_diff function directly in your code:
from tilelang.utils.pass_diff import pass_diff
from tilelang import tvm

# Diff a single pass
pass_diff(func, tilelang.transform.ThreadSync("shared"))

# Diff a chain of named passes
pass_diff(func, [
    ("AnnotateDeviceRegions", tvm.tirx.transform.AnnotateDeviceRegions()),
    ("SplitHostDevice",       tvm.tirx.transform.SplitHostDevice()),
    ("ThreadSync",            tilelang.transform.ThreadSync("shared")),
], mode="html")
Parameter |
Description |
|---|---|
|
A |
|
A single pass or a list of |
|
|
|
Number of context lines in the unified diff (default: 3) |
|
Output path for HTML report (default: |
How It Works
When enabled, the hook monkey-patches tvm.ir.transform.Pass.__call__ at import time. Every pass invocation is intercepted to capture the IR before and after, compute a unified diff, and emit the result in the chosen format. When disabled (the default), no patching occurs and there is zero overhead.
Tips
Use
terminalmode for quick checks — the colored diff is printed as passes run, so you can see changes in real time.Use
htmlmode for thorough analysis — the report lets you navigate across many passes, expand hidden context, and copy IR snippets.Combine with
TILELANG_PASS_DIFF_OUTPUTto direct reports to a specific location, e.g. when running in CI or comparing across runs.The hook captures all passes in the lowering pipeline, including those triggered internally by
tilelang.compile(). This makes it useful for understanding the full compilation flow.
AutoDD: Automatic Delta Debugging
When dealing with complex TileLang programs that produce errors, manually isolating the bug can be tedious. AutoDD (Automatic Delta Debugging) is a built-in tool that automatically simplifies your program to the minimal code needed to reproduce a specific error.
What is Delta Debugging?
Delta Debugging is an automated debugging technique that:
Takes a program that triggers a bug
Systematically removes code fragments
Checks if the simplified program still triggers the same bug
Produces the minimal code that reproduces the bug
AutoDD uses a Probability Distribution Driven Delta Debugging (PDD) algorithm for efficient minimization.
Why Use AutoDD?
Large codebases: Real projects often have hundreds of lines of configuration, helper functions, and logging
Hard-to-locate errors: Error messages may point to TVM/CUDA internals rather than your TileLang code
Time-saving: Manually deleting code to isolate bugs is very time-consuming
AutoDD can reduce a 200+ line program to just 30 lines, directly exposing the root cause.
Basic Usage
python -m tilelang.autodd <source_file> --err-msg "<error_message>" -o <output_file>
Parameters
Parameter |
Description |
|---|---|
|
Path to the input Python source file |
|
Error message to match (searched in stdout or stderr) |
|
Path to the minimized output file |
|
Execution backend: |
|
Timeout for each task in seconds, default 60 |
|
Number of parallel jobs, default 1 |
Example
Suppose you have a complex TileLang program with a GEMM shape mismatch bug:
# buggy_matmul.py (200+ lines)
@tilelang.jit
def buggy_matmul(M, N, K, block_M, block_N, block_K, ...):
    @T.prim_func
    def matmul_kernel(...):
        with T.Kernel(...) as (bx, by):
            A_shared = T.alloc_shared((block_M, block_K), dtype)
            B_shared = T.alloc_shared((block_M, block_N), dtype)  # Bug: should be (block_K, block_N)
            C_local = T.alloc_fragment((block_M, block_N), accum_dtype)
            # ... lots of other code ...
            T.gemm(A_shared, B_shared, C_local)  # Error here
    return matmul_kernel
Run AutoDD to minimize:
python -m tilelang.autodd buggy_matmul.py --err-msg "Dimension mismatch" -o minimized.py -j 4
AutoDD will produce a minimal reproduction:
# minimized.py (~30 lines)
import tilelang.language as T

def buggy_matmul(M, N, K, block_M, block_N, block_K, dtype=T.float16, accum_dtype=T.float32, *args, **kwargs):
    @T.prim_func
    def matmul_kernel():
        with T.Kernel():
            A_shared = T.alloc_shared((block_M, block_K), dtype)
            B_shared = T.alloc_shared((block_M, block_N), dtype)  # Bug exposed!
            C_local = T.alloc_fragment((block_M, block_N), accum_dtype)
            T.gemm(A_shared, B_shared, C_local)
How AutoDD Works
AutoDD uses AST (Abstract Syntax Tree) analysis with multiple rewrite rules:
Fast Reducers: Remove statements, simplify if/for constructs
Canonicalizers: Expand with statements, add
*args, **kwargsfor compatibilitySimplifiers: Replace expressions with constants, simplify function calls
Slow Reducers: Remove arbitrary expressions, reduce integer constants
Tips
Error message matching: Use a unique substring from the error output
Timeout: Increase
--timeoutfor programs with long compilation timesParallel jobs: Use
-j 4or higher to speed up minimizationBackend: Try
--backend subprocifrunneris unstable
Complete Example
A complete example is available in examples/autodd/:
tilelang_buggy.py: A complex program with a bug (~200 lines)tilelang_minimized_expected.py: Expected output after AutoDD (~30 lines)README.md: Detailed documentation
Conclusion
By carefully examining intermediate representations (IR) before final code generation—and by leveraging runtime printing through T.print—one can quickly diagnose where index calculations, copy logic, or other kernel operations deviate from the intended behavior. The Pass Diff tool complements this by providing automatic, pass-by-pass visibility into every IR transformation, making it easy to pinpoint exactly which pass introduces an unexpected change. This three-pronged approach (inspecting IR transformations, observing pass-level diffs, and using runtime prints) is often sufficient for resolving generation and correctness issues in TileLang programs.
For complex programs where manual debugging is tedious, AutoDD provides automated delta debugging to quickly isolate the minimal code that reproduces a bug.
For advanced performance tuning (e.g., analyzing memory bandwidth or occupancy), more specialized profiling tools such as Nsight Compute, rocProf, or vendor-specific profilers may be required. Those aspects will be covered in future documents.